Wireless devices like temperature and humidity sensors, light switches, garage remotes, power sockets are usually sending and receiving their data in a simple binary format over radio, technically: on-off keying (OOK).
Decoding these messages by eye might seem tricky at first but it can be done quickly once you know the how. Although there are softwares to do this automatically, it is a fun excercise and gives a better understanding of the messages in the air.
Intro
Softwares I use in this post and find useful:
- Gqrx SDR – to inspect the radio spectrum and capture the messages
- Audacity – to visually inspect the captured data and decode by eye
- RTL 433 – receiving and decoding messages on the command line
- Domoticz – to (automatically) register devices and decode their messages, draw graphs and even control some of them
I have a Nooelec NESDR Mini that I used in the screenshots below but it should work with any Software Defined Radio (SDR).
Although I am talking about 433 MHz, the message format is independent from the frequency – however if you plan to buy any device see Note 1 on the bottom of the page.
The easy way
Just start a decoder, wait for your message to arrive and you’re done.

Hey, that’s cheating!
The line format
There are two formats commonly used by these communications: Pulse Width Modulation (PWM) and Pulse Position Modulation (PPM). They both encode binary values (zeros and ones) but differently. I have added vertical lines to highlight the beginning of the values.
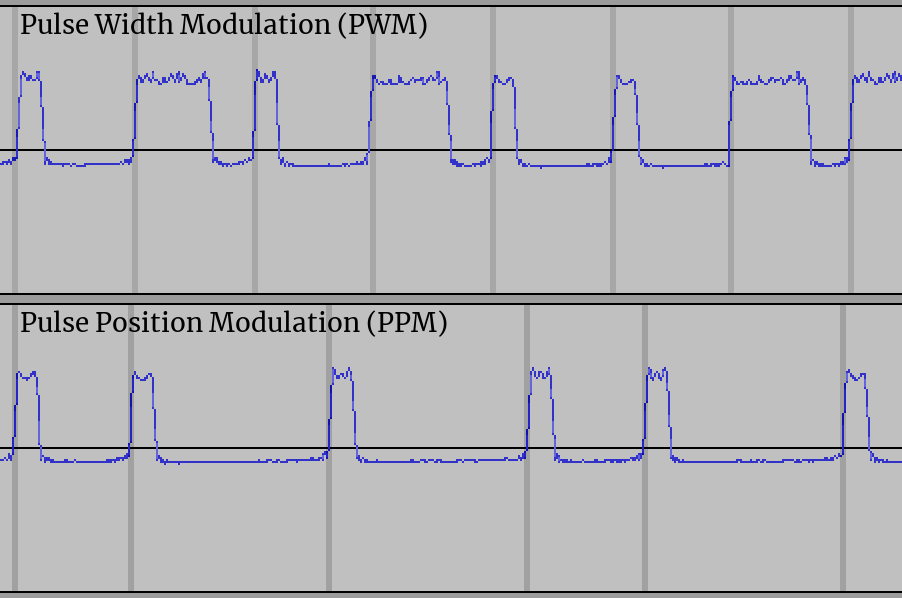
PWM encodes the data by sending a short pulse then a long pause or a long pulse then a short pause. Depending on the protocol used one means one the other zero. Note that the transmissions have a fixed length.
PPM encodes the data by sending a fixed length pulse, then a short or long pause before sending the next – the short period encodes a zero, the long encodes a one – or reversed, depending on the protocol used. Note that the two values have different lengths.
Capturing the message
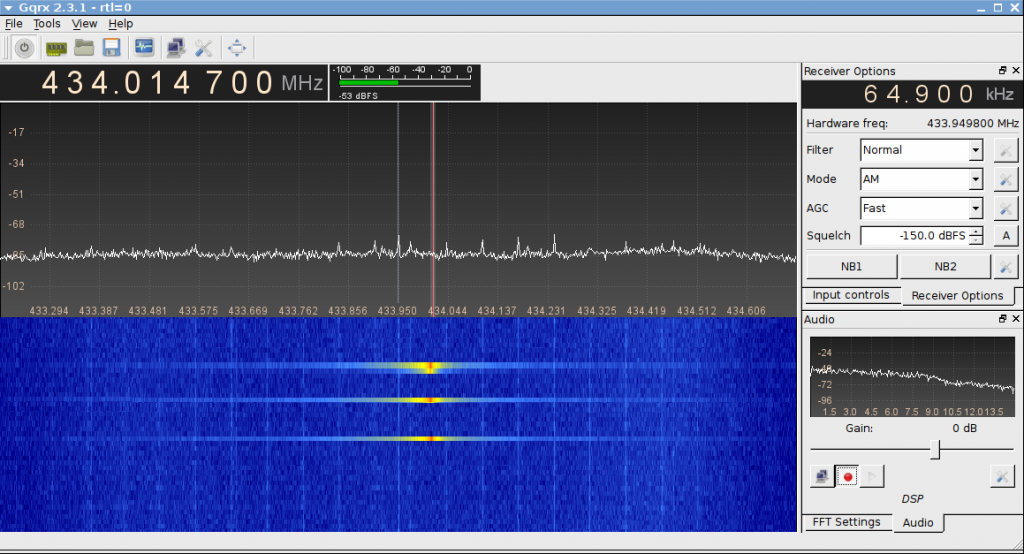
I am using Gqrx as it is a fairly standard SDR on Linux and works just fine.
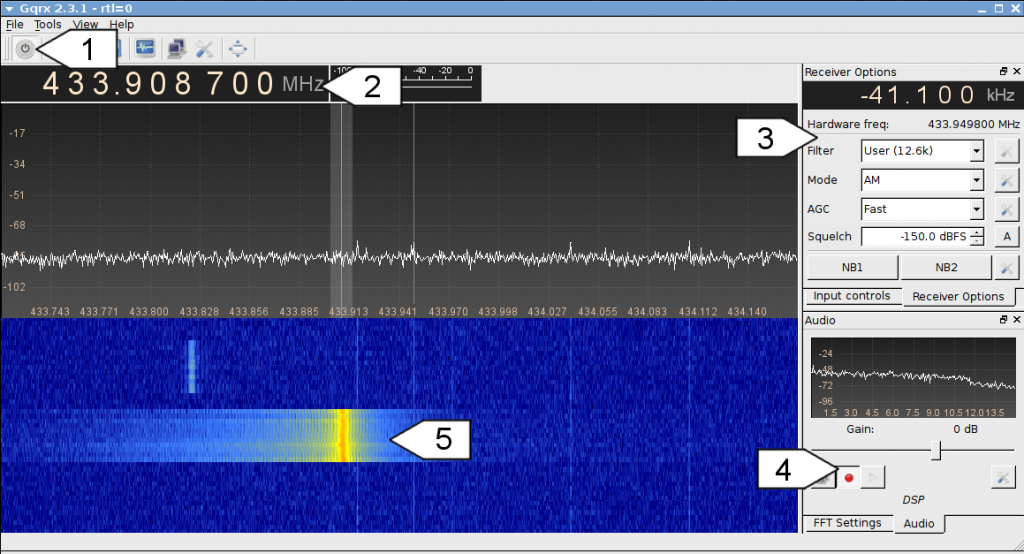
First you need to start the processing (1), then find the frequency you’re intereted in using the tuner (2). If you find the frequency you’re looking for, set the receiver to AM and filter to Normal (3) then you can start recording using (4). The message is marked with (5) in this screenshot.
The output will be a WAVE audio file (.wav) that can be opened using any sound editor software.
Note: you might need to adjust gains to have a clear signal, try to fiddle with LNA gain on Input controls tab and Gain on Audio tab.
Checking the captured message
I used Audacity in this post but any sound editor will do the job, you only need to zoom in on parts of a WAVE file.
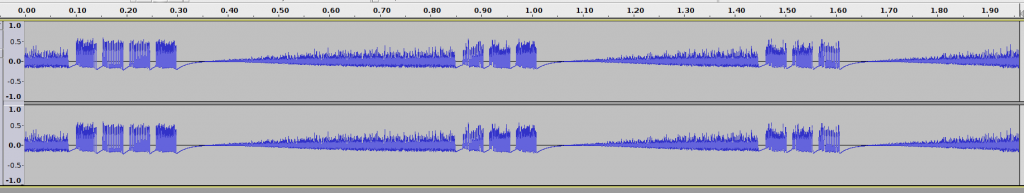
After opening the recording you should see something like this.
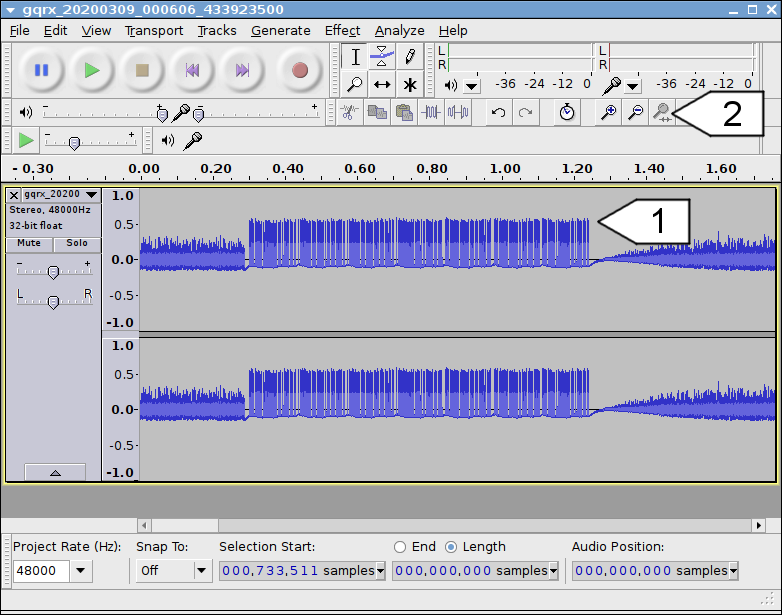
You should see some noise and some structure (1), the latter is the message you’ve captured. Select and zoom in to it using (2).
Notice that the message seems to be repeated – there are larger gaps and then the packet starts again (gap, 1 peak, 3 peaks, …).
It is very common for a message to contain the same packet multiple times, as the trasmitters are not synchronised, all of them send as they like, collisions are common. Repeating the data increases the chance of a clear reception.
In this case the wireless thermometer sends the package 7 times, leaving a long gap between each time, according to its protocol. Zoom in on the first one.

Decoding by eye
After we successfully found the useful part of the message all we need to do is decoding it. Easy, right?
If you don’t know the packet format but know the measurements transmitted (as this is a temperature and humidity meter) you can guess the format. Most of the sensors send the data in a very basic format, usually the temperature in 0.1 °C and humidity in percent.
By fiddling these values, one at a time, capturing and decoding the packets we can find the bits that change and find out their meaning.
There are a few things to consider when guessing the format:
- modulation: PPM or PWM
- gap length – bit value pairing: is the short zero and long one or the other way around
- bit-endiannes: the order of bits in bytes. 131 (128+2+1) can be encoded two ways 10000011 (big endian) or 11000001 (little endian)
- checksum: if there is a part of the message that changes when any of the other part changes, that might be a checksum and can be ignored when eye-decoding (not common)
- rolling code: if there is a part that changes with all transmissions it might be rolling code, can be ignored as well (not common)
- sequence number: if a part increases with every transmission it might be a sequence, can be ignored as well (not common)
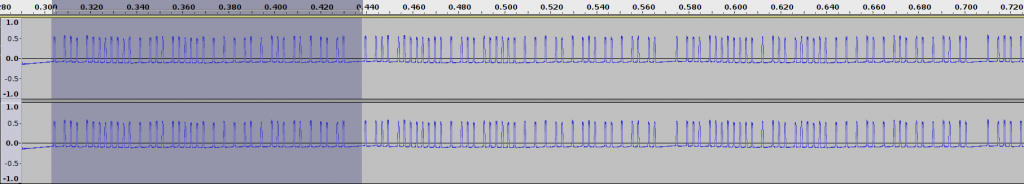
First of all, the length of the pulses seems to be uniform but the gaps change. It looks like Pulse Position Modulation (PPM), let’s assign a value for the gaps – zero for the short ones, one for the long ones.

So we know the following parameters (either because it is a switch or because it is displayed on the device):
- the sensor was set to channel #2,
- temperature was 12.3 °C,
- humidity was 45%.
Let’s capture and decode more packets, while keeping an eye on the parameters:
-------------------------------- data --- chan  temp  humi
10010000 00011001 00000111 10110010 11010    2  12.3    45
10010000 00011001 00000111 11000010 11010    2  12.4    45
10010000 00011001 00000111 11010010 11010    2  12.5    45
10010000 00011001 00000111 11010011 00100    2  12.5    50
10010000 00011001 00000111 11010011 11000    2  12.5    60
10010000 00011001 00000111 11010011 11000    2  12.5    60
10010000 00011010 00000111 11010011 11000    3  12.5    60
10010000 00011000 00000111 11010011 11000    1  12.5    60
10010000 00011000 00000111 11100011 11000    1  12.6    60
10010000 00011000 00000111 11100100 00010    1  12.6    65
10010000 00011000 00010000 00110100 00010    1  25.9    65
xxxxxxxx xxxxxxcc xxxttttt ttttthhh hhhhx
By noting which bits change when a parameter changes we can find and mark the correlations – see the last line, I marked “c” for channel change, “t” for temperature, “h” for humidity.
In the case of this device we can conclude the following with great certainty:
- channel is sent on bits 15-16, value is “switch position – 1”, big endian,
- temperature is sent on bits 20-29, value is in 0.1 °C, big endian,
- humidity is sent on bits 30-36, value is in percent, big endian,
- the rest of the bits are still unknown to us.
To increase certanity we should test more, but I am happy with these results for now, feel free to continue.
Decoding another device
I also have an RF remote with several buttons. I started a capture the same way as described before and pressed three buttons:
… opened it in Audacity:
… as I held the buttons for a short amount of time, the remote sent the packet 3-4 times. Cutting those and the noise here are the three buttons:

These packets look different than before, the pulses are different in length but with the gaps the bits seem to be consisten in length – so this looks like PWM.
Note: as this is binary data the difference in amplitudes (height of the signal) does not matter, it is an artifact of the sender/receiver.
Let’s assign one and zero values for the short/long pulses and start decoding by eye:

So it seems that significant part of the packet is constant, only four bits (marked in teal) varies, these must be the values for the buttons.
We will validate these findings in an upcoming blog post.
Using software to receive and decode the packets
So after decoding by hand let’s see a software doing this for us. I use RTL 433 here, it grabs the first SDR it finds and tunes automatically to 433.92 MHz – handy.
Currently it knows around 145 devices (or packet formats), adding -A switch shows a dump of the received package and some analytics it uses to parse it.
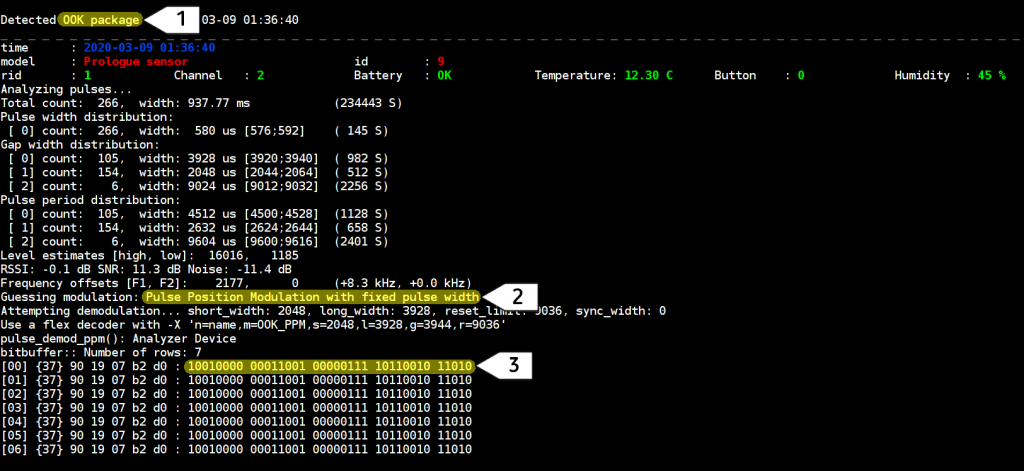
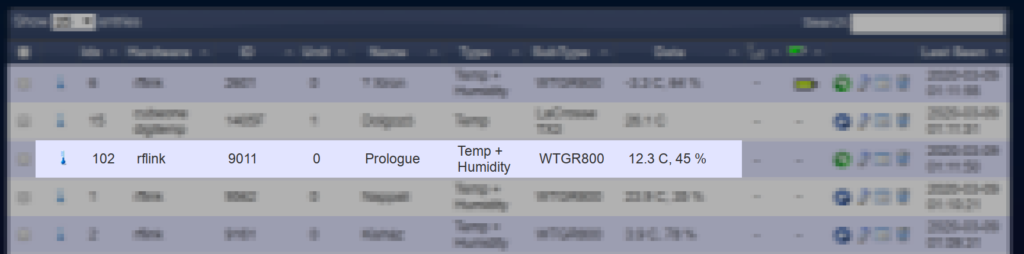
First of all, the colored part (that I showed earlier) shows the parsed data, (1) indicates it is an on-off keying (OOK) encoded packet, (2) shows it is indeed PPM and (3) is the actual decoded data.
Another great advantage is that RTL 433 being an open source software, you can check out the decoder and the documentation for the protocols. For the Prologue sensor looks like this:
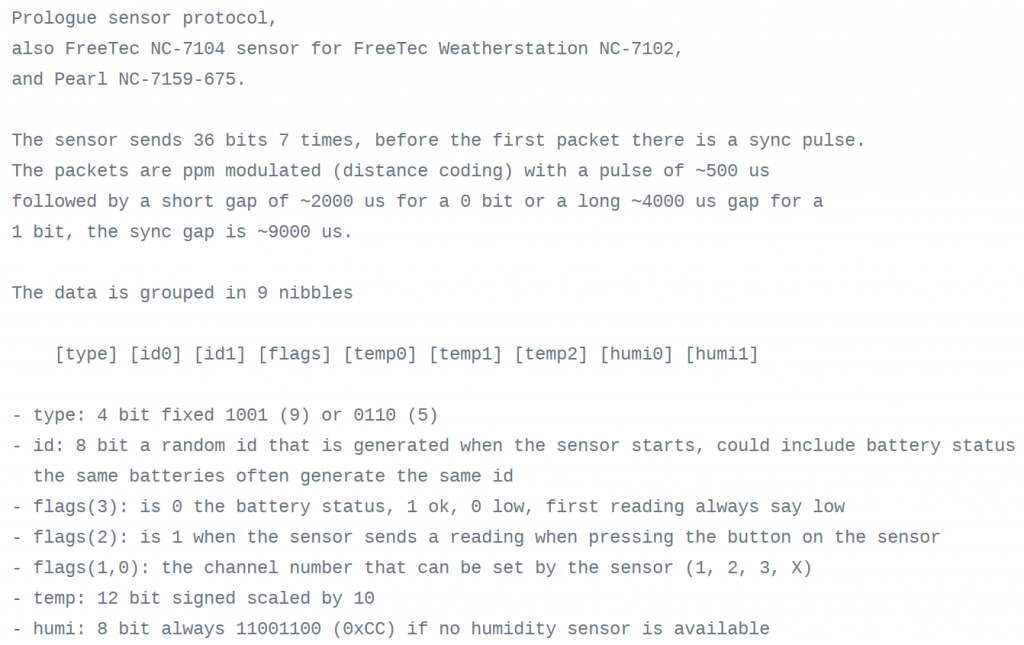
More info here: https://github.com/merbanan/rtl_433/blob/master/src/devices/
More
Dave posted in detail about setting up a remote controlled Balsam Hill Christmas tree from scratch in his OpenHAB home automation system, with Alexa integration. It is a good read, if you enjoyed this one I highly recommend checking his post out, too: Automating a Balsam Hill Artificial Tree
Coming up next
In a future post I will share how to send packets by copying the ones we captured and also creating our own.
Notes
Note 1: In Europe the most common frequency these devices use is 433.92 MHz, which is usually referred as “433 MHz” and sometimes “434 MHz”. There are two other frequencies typically used, 433.42 MHz and 868.3 MHz. In the US 915 MHz is typical (for more precise definitions see ITU and search for your country). It is important to note that not all receivers support multiple frequencies, you might need separate receivers for each.
Really great article – well written, super clean and with code links that actually worked. Very impressive stuff – and some great ways to visualise what’s going out over radio. I just checked the date – and have only just come accross the article – its aged very well. Still relevant and as I said, all the code above was easy to obtain and get running.
I’d think its pretty easy for a competent programmer to create their own transmitter device – so if you haven’t written the follow up article – maybe best left to the readers imagination – as a challenge :-D
Great job.
Hey Steve, thanks for the nice words :) I experimented with transmitting signals using an AVR microcontroller (ATtiny84 or ATtiny85) and succeeded with it but the article is yet to come. I’d like to revisit that project and write a similar post about it but I can’t promise anything. Anyways, I’m glad you liked this one and it was useful to you!
Hello Gábor!
Köszi a jól összefoglalt leírást! Épp most küzdök egy ilyen külső hőmérővel; nagy segítség volt így egyben olvasni!
Üdv, Gábor
Szia Gábor!
Örülök, hogy hasznos volt! Sok sikert a hőmérős projektedhez! :)
Üdv:
Gábor